Getting Started
Preface
As an example, we are going to use a Building a Basic Chatbot from LangGraph documentation.
Setup
Creating experiment
First, start with creating an experiment folder structure for storing all of Your working data. The data by default will be stored in experiments - a directory automatically created by a package
(however you are able to save it in another location by using optional base_dir attribute).
To create an experiment, you can use the function langgraph_compare.experiment.create_experiment().
This can be done like this:
from langgraph_compare.experiment import create_experiment

exp = create_experiment("test")
Function should create a folder structure in experiments containing folders csv, db, img, json and reports.
experiments/
└── test/
    ├── csv/
    ├── db/
    ├── img/
    ├── json/
    └── reports/
For more details, refer to the documentation of the langgraph_compare.experiment module.
Setting up the database
This package leverages SqliteSaver from LangGraph which allows saving checkpoints in a SQLite database.
The benefit of using previously mentioned create_experiment is the fact that You don’t have to define the paths manually - you can just refer to the properties.
To initiate connection to SQLite database correctly, be sure to do the following:
from langgraph_compare.experiment import create_experiment

# Init for experiment project structure
exp = create_experiment("test")

# Initiate connection
memory = exp.memory

# Rest of the code...

# Remember to compile your graph with SQLite as checkpointer memory
graph = graph_builder.compile(checkpointer=memory)
Running graph multiple times
Since the aim of this package is to monitor and compare multi-agent architectures - we need to run the graphs multiple times to be able to compare the results.
Because of this, I’ve created langgraph_compare.graph_runner.run_multiple_iterations().
This function will create a thread for every single run of the graph - starting from selected starting_thread_id.
Example:
from langgraph_compare.graph_runner import run_multiple_iterations

# Rest of the code... (building graph etc.)

# Graph with SQLite checkpointer memory
graph = graph_builder.compile(checkpointer=memory)

# This takes graph and runs it 5 times - creating 1 thread for every single run, starting from thread_id=1
run_multiple_iterations(graph, 1,5, {"messages": [("user", "Tell me a joke")]})
For more details, refer to the documentation of the langgraph_compare.graph_runner module.
Preparing data for analysis
Preparation of data can be easily achieved by using langgraph_compare.artifacts.prepare_data() from module langgraph_compare.artifacts.
However, before doing so I would strongly recommend to read documentation bellow since it shows how to use GraphConfig - a custom class that defines how a graph was configured, so parser can parse accordingly.
If you want to see how to use langgraph_compare.artifacts.prepare_data() refer to Exporting data using prepare_data.
Exporting SQLite to JSON’s
After running graph multiple times, we need to retrieve the data from the SQLite database.
For this, I’ve created a function langgraph_compare.sql_to_jsons.export_sqlite_to_jsons() that retrieves data from the database and deserializes it from msgpack.
Post deserialization - function saves every single thread to a separate json file.
Once again - the benefits of using create_experiment - you can just refer directly to experiment.
Example:
# Needed imports
from langgraph_compare.experiment import create_experiment
from langgraph_compare.sql_to_jsons import export_sqlite_to_jsons

# Init for experiment project structure
exp = create_experiment("test")

# Rest of the code...

# Exporting using experiment
export_sqlite_to_jsons(exp)
Folder structure should like this now:
experiments/
└── test/
    ├── csv/
    ├── db/
    │   └── test.sqlite
    ├── img/
    ├── json/
    │   ├── thread_1.json
    │   ├── thread_2.json
    │   ├── thread_3.json
    │   ├── thread_4.json
    │   └── thread_5.json
    └── reports/
For more details, refer to the documentation of the langgraph_compare.sql_to_jsons module.
Exporting JSON’s to CSV
We retrieved the data from the database. Now it’s time to create a csv file that can be loaded as an event log.
For this, I’ve created langgraph_compare.jsons_to_csv.export_jsons_to_csv().
This function takes every singe json file from a selected directory and parses it - extracting all the necessary data to create an event log.
This requires langgraph_compare.jsons_to_csv.GraphConfig a custom class that defines how a graph was configured, so parser can parse accordingly.
In this example, we will focus on a basic usage of GraphConfig.
I dive deeper into GraphConfig in Advanced Examples.
Example:
In case of Building a Basic Chatbot, we have only one node called chatbot_node.
Because of that, we will only have one node in nodes list. Once graph config is defined, we can execute the needed method to export all JSON’s to one csv file.
In this case, You can also use the benefits of create_experiment.
# Needed imports
from langgraph_compare.experiment import create_experiment
from langgraph_compare.jsons_to_csv import GraphConfig, export_jsons_to_csv

# Init for experiment project structure
exp = create_experiment("test")

# Rest of the code...

# Basic graph config
graph_config = GraphConfig(
nodes=["chatbot_node"]
)

# You can provide You own file name as an optional attribute csv_path.
# Otherwise it will use the default file name - "csv_output.csv"
export_jsons_to_csv(exp, graph_config)
Folder structure should like this now:
experiments/
└── test/
    ├── csv/
    │   └── csv_output.csv
    ├── db/
    │   └── test.sqlite
    ├── img/
    ├── json/
    │   ├── thread_1.json
    │   ├── thread_2.json
    │   ├── thread_3.json
    │   ├── thread_4.json
    │   └── thread_5.json
    └── reports/
For more details, refer to the documentation of the langgraph_compare.jsons_to_csv module.
Exporting data using prepare_data
This function simplifies the process of exporting data to csv file by running previously mentioned functions.
from langgraph_compare.experiment import create_experiment
from langgraph_compare.jsons_to_csv import GraphConfig
from langgraph_compare.artifacts import prepare_data

# Init for experiment project structure
exp = create_experiment("test")

# Rest of the code...

# Basic graph config
graph_config = GraphConfig(
nodes=["chatbot_node"]
)

prepare_data(exp, graph_config)
This function will run the export_sqlite_to_jsons and export_jsons_to_csv in order preparing the data for analysis.
Running analysis
We’ve successfully parsed JSON’s into the csv file. Now we can run analysis on the event log.
I’m not going to go into details on every single function and what it does - we will focus on one that prints full analysis into the console - since it’s the easiest way to see the analysis.
You can find every function specification in modules here:
langgraph_compare.analyze- for running analysis on everythread_id(case_id)langgraph_compare.analyze_case_id- for running analysis on singlethread_id(case_id)
In both examples we will use langgraph_compare.load_events.load_event_log() from module langgraph_compare.load_events to load event log we will use in analysis.
Analysis on entire event log
In case of printing analysis for entire event log, we will use langgraph_compare.analyze.print_analysis() from module langgraph_compare.analyze.
# Needed imports
from langgraph_compare.experiment import create_experiment
from langgraph_compare.load_events import load_event_log
from langgraph_compare.analyze import print_analysis

# Init for experiment project structure
exp = create_experiment("test")

# Rest of the code...

# Using experiment to load events from .csv file
# You can also provide path directly as a string
event_log = load_event_log(exp)

# This function will print an analysis in console for entire event log
print_analysis(event_log)
This will return information for every thread_id (case_id) about the following:
start activities
end activities
count of each activity (summed from every case)
every sequence
ID of last sequence occurrence with probability of occurrence
minimal self-distances for every activity (on case basis)
witnesses of minimum self-distances (on case basis)
count of activity rework (on case basis)
mean duration of every activity (in sec)
duration of the case (in sec) (on case basis)
Analysis on single case_id
In case of printing analysis for single case_id, we will use langgraph_compare.analyze_case_id.print_case_analysis() from module langgraph_compare.analyze_case_id.
# Needed imports
from langgraph_compare.experiment import create_experiment
from langgraph_compare.load_events import load_event_log
from langgraph_compare.analyze_case_id import print_case_analysis

# Init for experiment project structure
exp = create_experiment("test")

# Rest of the code...

# Using experiment to load events from .csv file
# You can also provide path directly as a string
event_log = load_event_log(exp)

case_id = 15

# This function will print an analysis in console for single case_id
print_case_analysis(event_log,case_id)
This will return information for single thread_id (case_id) about the following:
start activity
end activity
count of each activity
sequence of activities with probability of occurrence for the sequence
minimal self-distances for every activity
witnesses of minimum self-distances
count of activity rework
sum service time of every activity (in sec)
duration of the case (in sec)
Generation
You can easily generate visualizations and reports using langgraph_compare.artifacts.generate_artifacts().
This function will generate visualizations and reports for entire event log.
# Needed imports
from langgraph_compare.experiment import create_experiment
from langgraph_compare.load_events import load_event_log
from langgraph_compare.artifacts import generate_artifacts

# Init for experiment project structure
exp = create_experiment("test")

# Rest of the code...

# Graph is needed for the mermaid graph
graph = graph_builder.compile(checkpointer=memory)

# Using experiment to load events from .csv file
# You can also provide path directly as a string
event_log = load_event_log(exp)

# Function for generating and saving reports for entire event_log via experiment
generate_artifacts(event_log, graph, exp)
If you would like to generate it manually, you can refer to the sections below.
Creating visualizations
We are going to use langgraph_compare.visualize.generate_visualizations() to generate and save every visualization available.
You can find every function specification in module langgraph_compare.visualize.
Once again, utilize the create_experiment properties.
# Needed imports
from langgraph_compare.experiment import create_experiment
from langgraph_compare.load_events import load_event_log
from langgraph_compare.visualize import generate_visualizations

# Init for experiment project structure
exp = create_experiment("test")

# Rest of the code...

# Graph is needed for the mermaid graph
graph = graph_builder.compile(checkpointer=memory)

# Using experiment to load events from .csv file
# You can also provide path directly as a string
event_log = load_event_log(exp)

# Function saving every visualisation - via experiment
generate_visualizations(event_log, graph, exp)
Folder structure should like this now:
experiments/
└── test/
    ├── csv/
    │   └── csv_output.csv
    ├── db/
    │   └── test.sqlite
    ├── img/
    │   ├── dfg_performance.png
    │   ├── mermaid.png
    │   └── prefix_tree.png
    ├── json/
    │   ├── thread_1.json
    │   ├── thread_2.json
    │   ├── thread_3.json
    │   ├── thread_4.json
    │   └── thread_5.json
    └── reports/
Sample graphs:
This graph can also be generated using langgraph_compare.visualize.generate_performance_dfg().
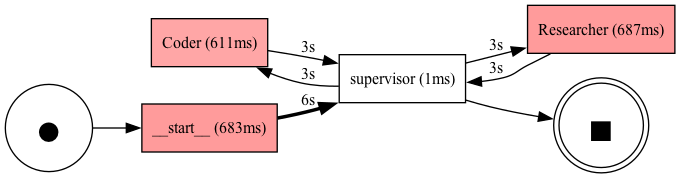
Sample performance dfg
This graph can also be generated using langgraph_compare.visualize.generate_mermaid().
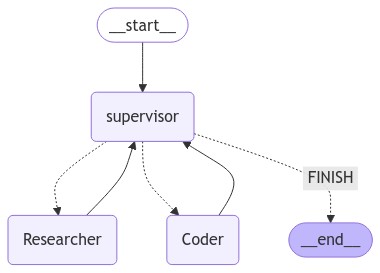
Sample mermaid graph
This graph can also be generated using langgraph_compare.visualize.generate_prefix_tree().
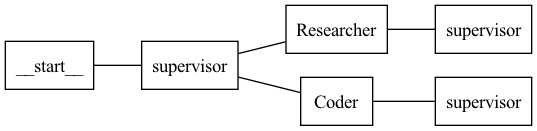
Sample prefix tree
Generating JSON report for entire Event Log
We can generate report for entire event_log.
The report will be saved in a json format and will be used in a HTML comparison report.
As in previous cases, we can use create_experiment properties.
In case of entire log, we will need to use a langgraph_compare.create_report.generate_reports().
# Needed imports
from langgraph_compare.experiment import create_experiment
from langgraph_compare.load_events import load_event_log
from langgraph_compare.create_report import generate_reports

# Init for experiment project structure
exp = create_experiment("test")

# Rest of the code...

# Using experiment to load events from .csv file
# You can also provide path directly as a string
event_log = load_event_log(exp)

# Function for generating and saving reports for entire event_log via experiment
generate_reports(event_log, exp)
Folder structure should like this now:
experiments/
└── test/
    ├── csv/
    │   └── csv_output.csv
    ├── db/
    │   └── test.sqlite
    ├── img/
    │   ├── dfg_performance.png
    │   ├── mermaid.png
    │   └── prefix_tree.png
    ├── json/
    │   ├── thread_1.json
    │   ├── thread_2.json
    │   ├── thread_3.json
    │   ├── thread_4.json
    │   └── thread_5.json
    └── reports/
        ├── metrics_report.json
        └── sequences_report.json
Generating architecture comparison
You can generate architecture comparison report by executing langgraph_compare.create_html.compare() and
supplying the metod with the list of architectures You would like to compare. Function will look for experiments
by default in the experiments folder (however if needed - You can specify the paths directly). After generating the function should automatically save the report in:
comparison_reports directory and open the report in Your default browser.
# Needed imports
from langgraph_compare.create_html import compare

# List the experiments you would like to compare
infrastructures = ["test_1", "test_2"]

# Run the function to generate comparison report
compare(infrastructures)
This should generate the HTML report called test_1_vs_test_2.html in comparison_reports directory.